


Kelly's Weekly Bitcoin Chart Predictions (From 6/4 to 6/10)
- Taking a break from long decline
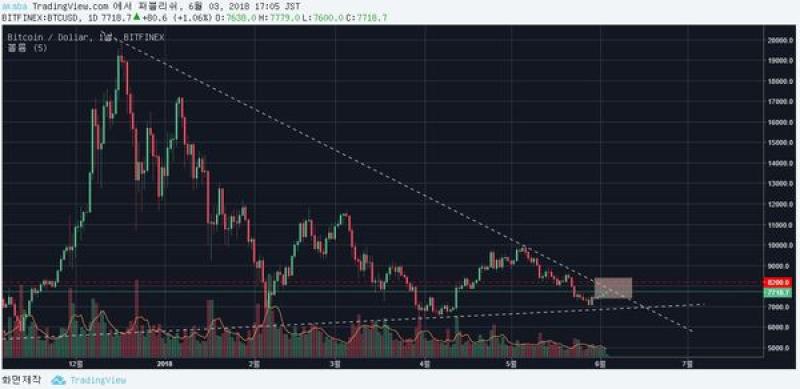
This week's bitcoin rebounded from the 5.29-day mark and took a break from a long decline.
But, since it’s at the end of triangular convergence, there is no guarantee that there won’t be any major changes to the current trend. Due to the nature of triangular convergence, people should pay attention to its direction after the convergence.
In addition, when bitcoin reaches the resistance line, we can say that it is effective to buy at the resistance line as we are retesting the existing resistance line.
It is expected that the bitcoin direction at the beginning of this week will be a big turning point for the direction of bitcoin in the future.
During the rise, the price of the resisting line range from $ 8200- $ 8400. In particular, the price of around $ 8200 seems to be a relatively strong resistance period because the 60-day moving average line and the volume profile at the bottom are overlapped. Take note of such data, when buying or selling bitcoins.
During the decline, the price of supporting range from $6800-7000 dollars, which is the support point of large triangular convergence.
It is expected to show volatility at from 21:00 to 5th of June to the 6th and there is a high probability that the direction of the bitcoin will be determined then.
Leave a Comment
Write As a Reporter

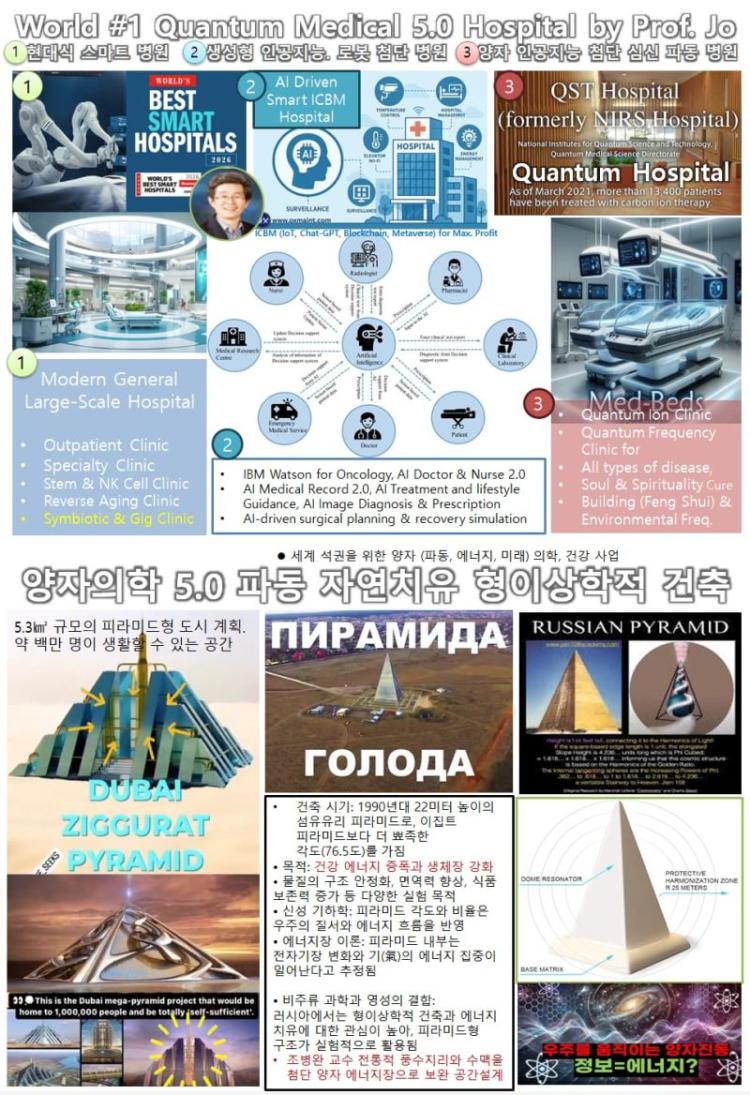
World #1 Quantum Medical 5.0 Hospital by...
2026-03-17 10:29
모빌테크-디스페이스코리아, 피지컬 AI 기...
2026-03-16 09:30

웹케시·로움아이티, 세무법인 아성...
2026-03-16 09:27

Coin 시황

티에스이-한국생산기술연구원, 반도체 테스트 기술 교...
2025-04-16 09:08

서울디지털재단, 아시아 최대 전자·정보박람회...
2025-04-11 16:35

Queue-it, 트래픽 제어 솔루션 업그레이드를 위한 기...
2025-04-07 11:51
 |
 |
 |
 |

오미선 2018-11-13 11:33
thankyou~
전수미 2018-11-01 20:16
GOOD