


Jefferey’s Weekly Bitcoin Chart Projection 6/18-6/24
Last week, the market was flat and pretty weak, as expected. As for this week, it js expected that the flat market will continue up until 6/22 in which the market will be more volatile with bigger ups and downs.
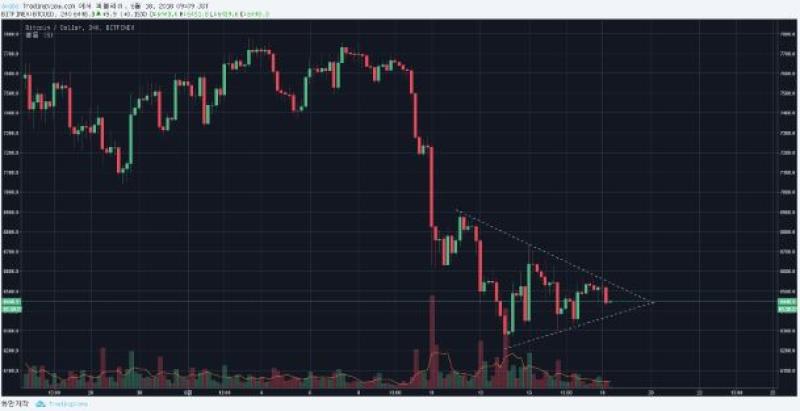
This is 4-hour candlestick chart of current market. Due to the nature of the triangular convergence, it seems necessary to respond quickly to the direction of convergence rather than to predict the rise and fall. The direction of convergence will be determined, at the latest on the morning of 6/20. Depending on the direction of the triangular convergence, deciding the buying and selling positions seems to be a good strategy.
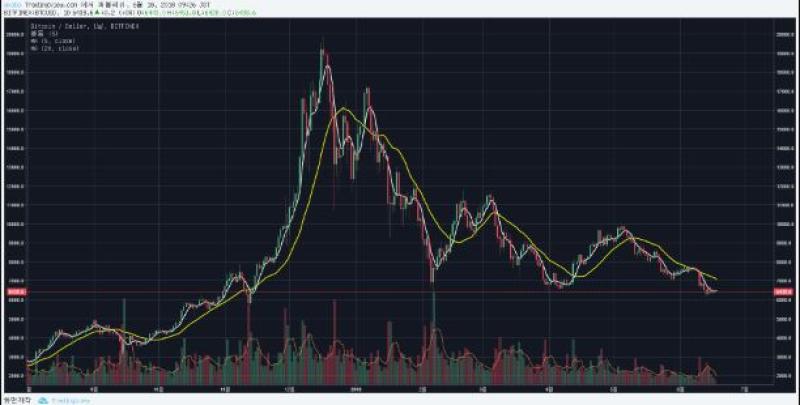
This is one-day candlestick chart. In the previous chart, the downward trend of the 5-day and 20-day shows that the market is not holding well.
Due to the nature of the moving average line, the disparity between the lines is expected to narrow as well as flat or rise in the market. However, we cannot rule out another decline in the market so it is crucial to follow any current events that could affect the market.
If you are looking for stable trading, we recommend you to closely watch the double bottom.
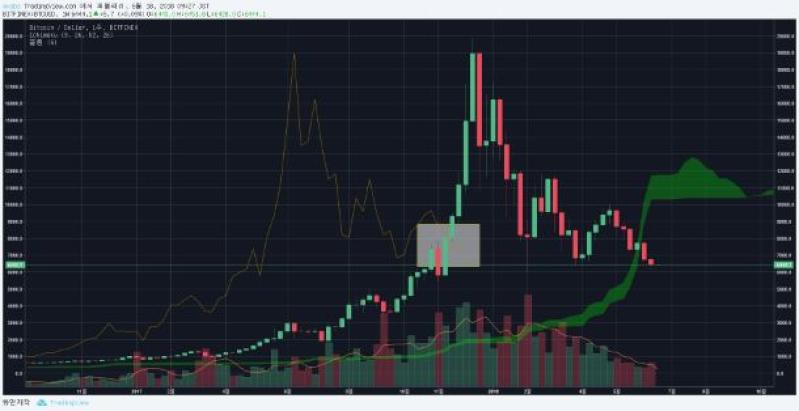
This is the one-week candlestick chart. The big picture on the week is the chikou span, making its first appearance since February 2015, which crossed the candlestick. Considering the chikou span, we cannot rule out a drastic drop in the Bitcoin price.
The main support lines range from $ 6,100 to $ 5,800, and the market seems to be stable around $ 6,900, which is roughly the peak of the 4-hour candlestick.
Leave a Comment
Write As a Reporter

블렌드엑스, AI 기반 브랜드 컨설팅 서비스...
2025-04-30 09:58

AI도 커스텀이 필요하다… 블루닷, ...
2025-04-16 09:14

생성형 AI 및 AR 활용해 운전자 편의성 개...
2025-04-16 09:01
Coin 시황
티에스이-한국생산기술연구원, 반도체 테스트 기술 교...
2025-04-16 09:08

서울디지털재단, 아시아 최대 전자·정보박람회...
2025-04-11 16:35
Queue-it, 트래픽 제어 솔루션 업그레이드를 위한 기...
2025-04-07 11:51
 |
 |
 |
 |

김용키 2019-01-20 09:56
감사합니다~
오미선 2018-11-13 13:52
good~
셋스킹 2018-11-11 23:43
thank you!
전수미 2018-11-01 21:03
잘 봤습니다