


Jeffrey’s Weekly Bit chart View (12/10~12/16)
Last week, Bit Chart showed additional decline reflecting the bad market situation.
In the previous article, I recommended on purchasing after exceeding the 20-day moving average in the minimum tradition condition for 4-hour peak instead of holding the low point. Bitcoin decreased over the last weekdays and increased slightly during the week. In present, the bitcoin exceeds the 20-day moving average for 4-hour peak.
Although the minimum trading condition is established, the bottom pattern for day peak has not come out yet.
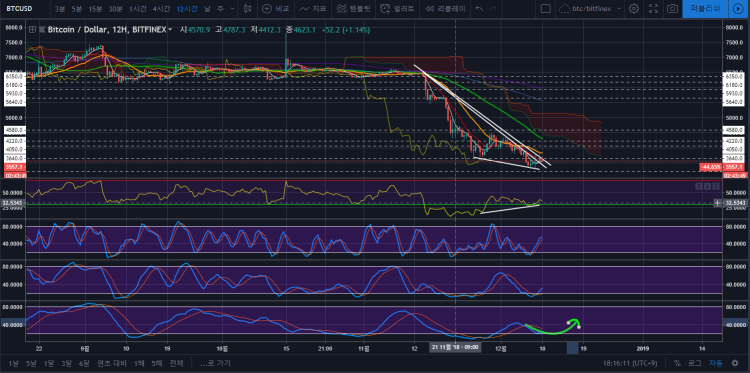
Above chart is the bit chart for 12 hours. Currently, the Bit Chart shows increase divergence. However, the trading volume and reliability for purchase are relatively low.
In the 12-hour peak, it is expected to have one more directionality after December 10. The best scenario would be the double bottom shape like the big green waves. In such scenario, the reliability for increase would go up.
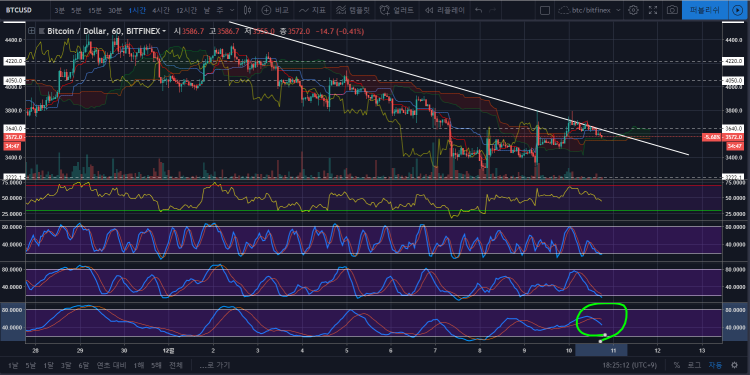
Above is the Bit Chart for 4 hours. As I told you last week, the coin exceeded the 20-day moving average and it is currently in the retesting process.
More stabilized purchase point would be after exceeding the trend line marked in white. In such situation, the selling point would be the previous low point of 3,360 dollars. Also, risk is high as bottom pattern has not been completed yet.
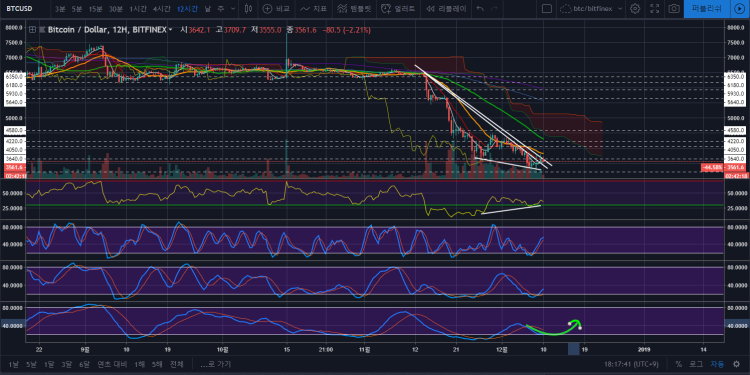
Above is the Bit Chart for 1 year. In the Ichimoku Chart, the line is located above the cloundband marked in red. Considering the cloundband and follow-up span, additional decrease may take place.
The minimum tradition entry condition would be the point where the big wave turns from upper part to down part instead of locating from down part to upper part as it is now. Thus, the current chart does not show movement moderate for trading. It is better to approach after observing the movement of the wave after exceeding the trend line and short-term trading strategy would be effective for now.
December 11, 6:00~7:00 would influence the market. The resistance line would be located between 3,640 dollars and 4,050 dollars and resistance line located between 4,000 dollars and 4,100 dollars have high reliability. Therefore, it is likely for the adjustment to happen instead of sharp increase.
The support lines are located in 3,220~3,270 dollars and the two lines have low reliability.
Columnist Jeffrey (news@dailycoinews.com)의 기사 더 보기
- Daily Coin News prioritizes the voice from the scene over others(news@dailycoinews.com) -
[copyrightⓒ 2018 All rights reserved by Daily Coin News]
Bitcoin price when registering article
BTC-USD : $ 3,497.30 USD (API by Bitfinex)
Leave a Comment
Write As a Reporter

블렌드엑스, AI 기반 브랜드 컨설팅 서비스...
2025-04-30 09:58

AI도 커스텀이 필요하다… 블루닷, ...
2025-04-16 09:14

생성형 AI 및 AR 활용해 운전자 편의성 개...
2025-04-16 09:01

Coin 시황

티에스이-한국생산기술연구원, 반도체 테스트 기술 교...
2025-04-16 09:08

서울디지털재단, 아시아 최대 전자·정보박람회...
2025-04-11 16:35
Queue-it, 트래픽 제어 솔루션 업그레이드를 위한 기...
2025-04-07 11:51
 |
 |
 |
 |

김용키 2019-01-14 20:05
공유 감사해요
셋스킹 2018-12-21 18:01
thank you !
전수미 2018-12-11 18:08
thanks jeffrey
오미선 2018-12-11 15:57
Thank you~