


Bitcoin Chart Analysis (6.11-6.17)
Last week, starting from 21:00 on June 5th, the bitcoin seemed to recover from its steep decline. However, due to fact that US Commodity Futures Trading Commission starting its investigation on bitcoin and its price change, there was another decline from yesterday to today, which led many people to panic sell. In the chart, the reliable long-term support lines are broken and market trends are expected to decline or be crossed over sometime next week.
Scenario 1
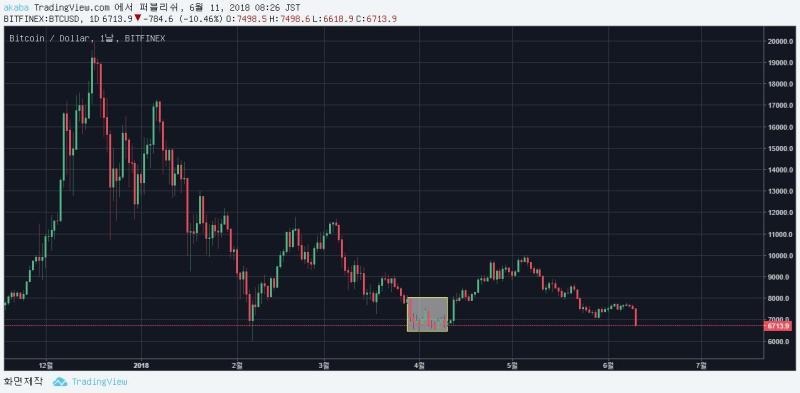
https // www. tradingview.com/x/p1 nymsBB / daybreak The movement is similar to what happened at the end of March 2018. At this point the bitcoin has dropped from $ 7,900 to $ 6,400 and a similar drop may occur.
Scenario 2
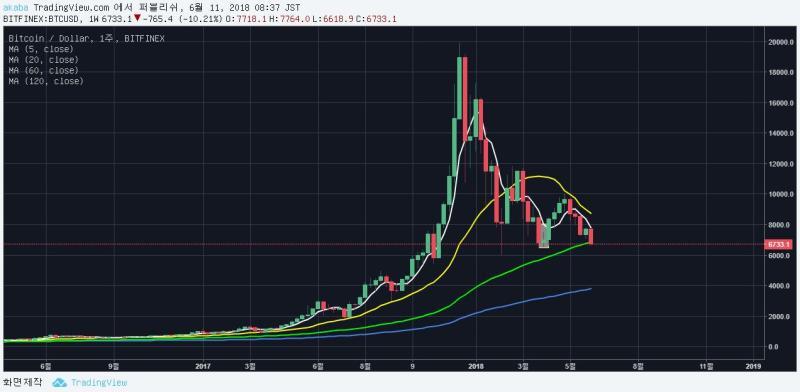
If the 60-day moving average line crosses the support line, you can expect to see a rebound up to $ 7,400.
Scenario 3:Downturn
If there is a decline, the expected rebound spot is near the 120-day moving average line, which is around $4,000.
As of now, we are unsure where the bottom of the chart is. Therefore, it is essential to take note of the cash rate adjustment and split purchase. The main resistance lines are $7,000 and $ 7350 to $ 7400, and the main supporting lines are the 60-day and 120-day moving average lines.
Leave a Comment
Write As a Reporter

블렌드엑스, AI 기반 브랜드 컨설팅 서비스...
2025-04-30 09:58

AI도 커스텀이 필요하다… 블루닷, ...
2025-04-16 09:14

생성형 AI 및 AR 활용해 운전자 편의성 개...
2025-04-16 09:01

Coin 시황

티에스이-한국생산기술연구원, 반도체 테스트 기술 교...
2025-04-16 09:08

서울디지털재단, 아시아 최대 전자·정보박람회...
2025-04-11 16:35

Queue-it, 트래픽 제어 솔루션 업그레이드를 위한 기...
2025-04-07 11:51
 |
 |
 |
 |

김용키 2019-01-22 06:06
땡큐땡큐!
오미선 2018-11-13 11:37
thankyou~
셋스킹 2018-11-11 23:43
thank you!
전수미 2018-11-01 20:33
잘봤습니다