


Prediction of bit for a week by Jeffrey (November 5th to November 11th)
Last week, the bit market ended with a white candlestick with a long tail and a short body per week. The issue of rapid increase of tether and the difference of prices among exchanges seem to have been resolved to some degree.
While the price gap between tether-based exchange and USD-based exchange did decrease from about $100 to $50, the price gap remains as a problem.
At the same time, the downward trend line from the 18th of the last month has been overcome, which is a good news.
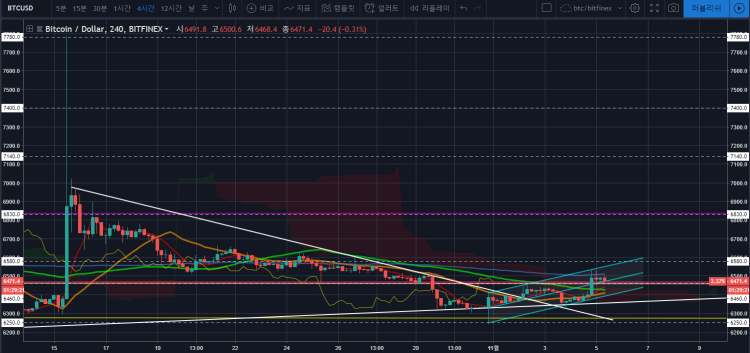
This is the four-hour chart of bit. The downward trend line has been overcome, retesting is finished, but it is showing a positive trend of going up.
Short-term moving average line in red is completing double bottom pattern; an additional increase is possible if retesting of $6,430 is completed.
Also it is stably settled after going through a cloud that is relatively thin, and a thick volume profile according to the one look equilibrium chart.
Moreover, the market is now in better condition, shows a yang cloud, and the lagging span is located well.
Bitcoin Cash and major altcoins show positive movements in their prices, which seem like a sign indicating a bull market ahead.
Last time, I mentioned the support level from $6,250 to $6,270; it was the lowest point for this time. Congratulations to anyone who have made purchase.
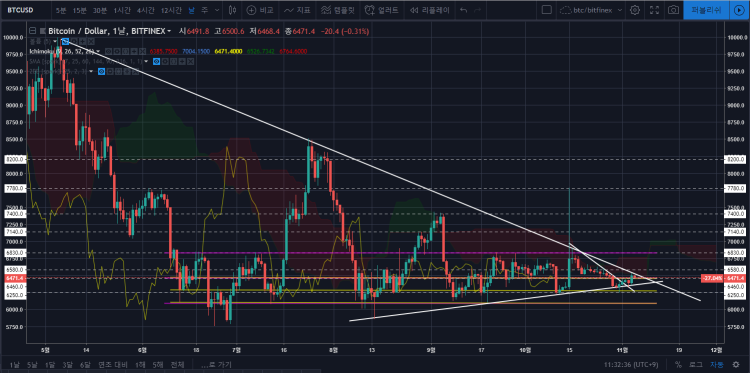
This is the bit chart per day. As you saw from the four-hour chart, there is a positive trend in part, but the long-term downward trend still remains. Moreover, per day, it still is at the bottom of a cloud.
Long-term downward trend line, volume profile, and the end of triangle show that volatility is low now; however, there can be more change soon.
Bit has been on the purple line since mid-August. There can be increased volatility when it surpasses and supports the upper part of the purple box, which is $6,830.
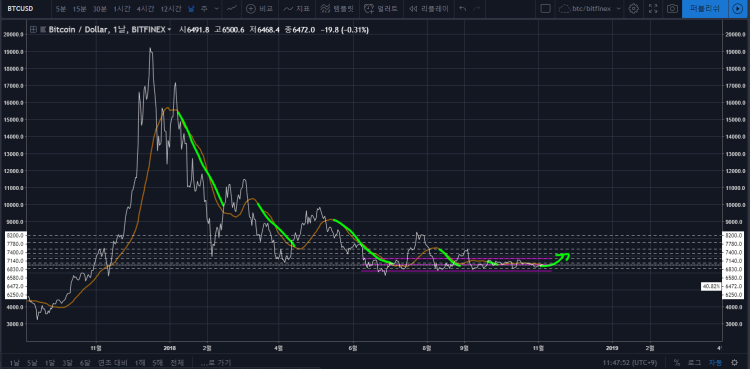
Lastly, this is the line bit chart per day. I believe details sometimes hide the key.
I removed the candlestick and created a line chart to emphasize the slope of the moving average line.
The slope is for the downward trend in the green line. It is clear that the situation is getting better.
We might see a bull market in the near future, while it is too early to make an announcement; many of you would have suffered a lot in the bear market.
Major resistance levels are $6,580, $6,830, $7,140, and $7,400.
- Daily Coin News prioritizes the voice from the scene over others(news@dailycoinews.com) -
[copyrightⓒ 2018 All rights reserved by Daily Coin News]
기사 등록시 비트코인 가격 (Bitcoin price when registering article)
BTC-USD : $ 6,467.30 USD (API by Bitfinex)
Leave a Comment
Write As a Reporter

WEIHENG, Starpower와 협력해 스마트 에너...
2024-04-24 14:20

커리어넷, 우체국물류지원단·코레일...
2024-04-24 14:11

한국산업인력공단 이우영 이사장, 신시웨이...
2024-04-17 14:07

Coin 시황

갤럭시아메타버스, NFT 전문 포털 앱 ‘엔타&rsq...
2024-04-17 14:10

블록오디세이, 영국 파이낸셜타임스 ‘아태 고성...
2024-04-14 12:01

TGV, 최고경영자로 베아트리체 라이언 임명… 2...
2024-04-04 10:54
 |
 |
 |
 |

김용키 2019-01-16 04:22
감사합니다~
임은교 2018-11-19 13:55
데일리 코인 뉴스 화이팅!
셋스킹 2018-11-14 21:59
good!
셋스킹 2018-11-11 15:25
good good
오미선 2018-11-07 15:04
good~~~
전수미 2018-11-06 17:37
좋아요