


Jeffrey’s Weekly Bit Chart View (1/7~1/13)
Last week, Bitcoin showed slight increase and finished with slight hope for future prices. Especially, the increase of low point in day candle shows the positive flow.
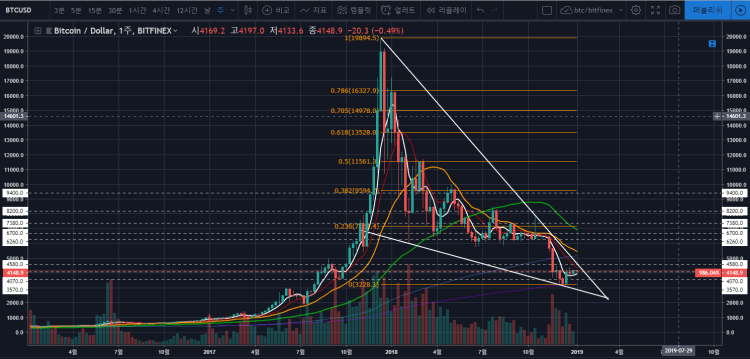
Above is Bit Chart for week candle. The falling wedge formation seems to be effective and primary matter would be breaking through and maintaining 4,380~4,500 dollars with concentration of moving average for 10 days. If breakthrough is made successfully, additional increase of 5,200~5,400 and 6,200 dollars can be expected.
Thus, this can be set as the target price for disposing coins.
Also, although there is no strong bottom-level volume, there seems to be less breakaway for volume coming from rally.
For now, as resistance group is concentrated, gentle angle is expected rather than explosive increase unless special favorable condition takes place.
For completing trading and disposing coins, 3,900 dollars seems to be adequate as 5-day week candle would be exceeded.
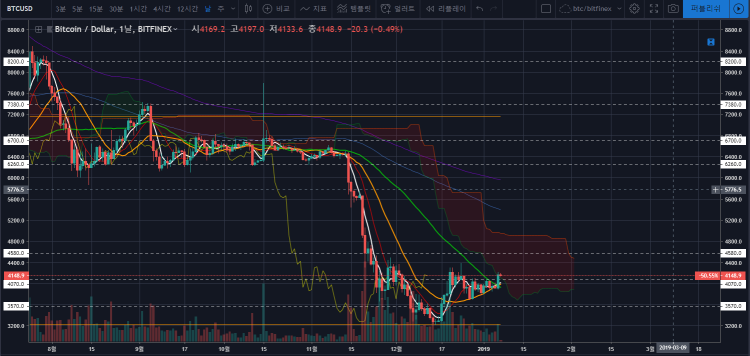
Above is day-candle chart. In Ichimoku Chart, lagging span penetrates the candle and locates above candle showing positive aspect.
Also, the long-term moving average is located in the lowest place, mid-term moving average is located in the middle, and short-term moving average is located on the top. Furthermore, the chart is showing positive aspects as golden cross in found in 20-day and 50-day moving average.
If low point is created higher than previous low point to form high point, there is possibility of inverse head and shoulder pattern. The target price of 5,200 ~5,300 dollars where top moving average meet seem to be appropriate.
Also, in conservative approach based on the assumption that this low point would be the lowest, the target value could be set to 0.236 Fibonacci ratio and 6,660~7,160 dollars (previous volume profile). However, this would be the long-term prospect.
In general, the conservatively weak wave in overseas futures show 0.236 rally in Fibonacci ratio. However, it should be considered that previous volume profile for 5,900 ~6,200 dollars is strong.
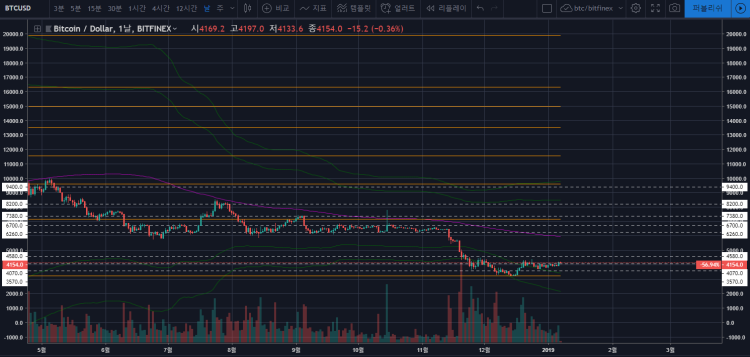
Above is another day-candle chart. The chart shows movements of candles toward volatility. In setting based on volatility index, the previous low point could be the bottom line.
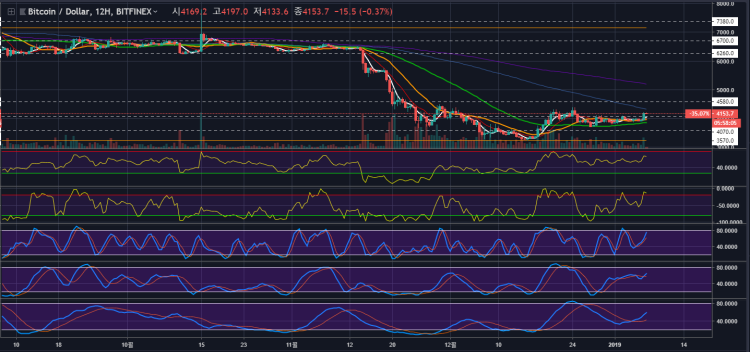
Above is 12-hour chart. The movement of big waves is formed positively in double-bottom chart pattern. This chart shows the movement in early stage of the week. Considering that above is 12-hour candle, it is necessary to observe the wave in middle stage of the week.
For 12-hour candle, the volume profile is found above 4,500 dollars and the volume profile is week before 5,800 ~6,200 dollars.
In conclusion, the top resistance exists in 5,200~5,400 dollars and 5,800~6,000 dollars. When breaking away from 3,900 dollars, it would be beneficial to complete trading.
Furthermore, the chart shows that long-term moving average is located in the lowest place, mid-term moving average is located in the middle, and short-term moving average is located on the top. The closest inflection point for market would be January 07, 18:00 PM.
Columnist Jeffrey (news@dailycoinews.com)의 기사 더 보기
- Daily Coin News prioritizes the voice from the scene over others(news@dailycoinews.com) -
[copyrightⓒ 2018 All rights reserved by Daily Coin News]
Bitcoin price when registering article
BTC-USD : $ 4,116.70 USD (API by Bitfinex)
Leave a Comment
Write As a Reporter

WEIHENG, Starpower와 협력해 스마트 에너...
2024-04-24 14:20

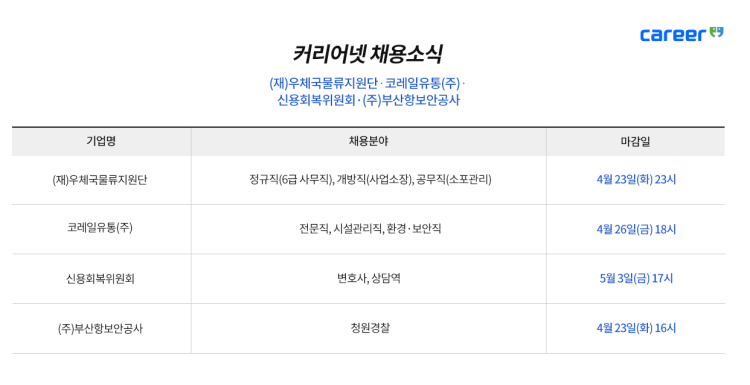
커리어넷, 우체국물류지원단·코레일...
2024-04-24 14:11
한국산업인력공단 이우영 이사장, 신시웨이...
2024-04-17 14:07

Coin 시황

갤럭시아메타버스, NFT 전문 포털 앱 ‘엔타&rsq...
2024-04-17 14:10

블록오디세이, 영국 파이낸셜타임스 ‘아태 고성...
2024-04-14 12:01

TGV, 최고경영자로 베아트리체 라이언 임명… 2...
2024-04-04 10:54
 |
 |
 |
 |

김용키 2019-01-14 15:53
감사합니다~
오미선 2019-01-10 13:28
thank you~
전수미 2019-01-08 20:43
잘 보고 갑니다